Computational Chemistry
GAMESS and ORCA are software packages, free for personal academic use (check that yourself), used to perform computational chemistry calculations. The GAMESS and ORCA software are black-boxs that can be run from the command line, but also using batch file scripts to execute several jobs. GAMESS and ORCA takes input files, typically, atom descriptions and coordinates in XYZ format, along with some specific instructions and settings that the engine will apply to the structures defined by the atom positions. The output of a calculation ("job") is another file, containing the desired computational output - in some cases, this may contain a series of XYZ 'frames', such as those that describe a vibration, or the atom trajectories as the molecule approaches a saddle point in a reaction mechanism. Other times we are interested only in some particular number, the energy or vibrational frequencies, which can be found in the output files.
The easiest way to get started with GAMESS, is to use a graphical front-end to draw the molecules (such as Avogadro), and then create from within the graphical user interface the GAMESS input file. The .inp file generated by the graphical front-end is saved to the "inputs" folder (for example, C:\Users\Public\gamess-64\inputs), and the GAMESS engine is invoked using a batch file. Several .inp jobs can be placed in the "inputs" folder, and all of them run either sequentially or simultaneously via tweaking some parameters (no elaboration here, sorry). For example, "runall.bat" executes all .inp jobs sequentially. Sometimes, it appears to be necessary to clear some temporary files, also achievable via running a batch file (clean-runall-files.bat). The output of the calculations are placed in the "outputs" folder with filenames correlating with the .inp files, but instead with .log file extensions. These .log files can be loaded into software packages that read .log GAMESS output files and enable visualisation and inspection of the calculation output. Such visualisation software packages include MacMolPlot
Alternatively, ORCA can used. A structure is defined in a
graphical editor, such as Gabedit. The geometry is optimised to
something realistic, using for example, MOPAC. With the proper
geometry, questions about the molecule can be asked in the form of ORCA
job input files (.inp). In Gabedit, clicking on the ORCA icon ( )
brings up the ORCA job input file, which can be edited to instruct
different computations. From "Run->Run a Computational Program (Ctrl+R)", then select
ORCA, then "OK". The ORCA output file will appear in the open files
window, and from here clicking the button "Update/end" will load the
current output from the ORCA script. Once ORCA has finished, the
end of the output file will state " ****ORCA TERMINATED NORMALLY****".
The results of the computation will sometimes be applied automatically
i.e., for geometry optimisation or vibrational analysis.
Othertimes, it may be desirable to view the results using the various
graphical interfaces accessible from the "Tools" menu, such as view
UV-Vis Spectrum or NMR Spectrum for instance.
Software
- GAMESS homepage at the Gordon Group at Iowa State ---- the engine
- wxMacMolPlot ----- for visualising the output
- Avogadro ---- for creating the input
- ORCA ---- the engine
- MOPAC homepage at Stewart Computational Chemistry group -- Structure optimisation and other semiempirical quantum chemistry calculations
- Gabedit ---- "Gabedit is a graphical user interface to computational chemistry packages" so sayeth the website.
Gabedit: Entering and optimising a structure with MOPAC
In Gabedit, from the Geometry menu --> Draw, the interface for entering structure is accessed. From this window, structures can be easily built using the fragment editor. It would be wise to do a preliminary optimisation of their structure using MOPAC to make the bond lengths and angle realistic -- this is achieved by applying a computational 'force field' which determines which atomic movements results in lower and higher energy structure -- the process is automatically repeated until the energy gradient becomes insignificant with the structure having approached the 'minimum energy'. To do this, right click the Drawing screen and from the menu "Semi-empirical", select "MOPAC Sparkle Optimisation". The results of this computation will flash up on screen in text, and may automatically close, and in its place will open an energy graph, with clickable points that correspond to the unique structural parameters that define a state between the initial structure, and the final lowest energy structure. These intermediate structures are not always useful -- it is common for the only result of interest being the "Last Geometry from an output file", which represents the best guess before the algorithm terminates.

Image above: The MOPAC Sparkle Optimisation output may temporarily flash up, only later to be replaced by the graph below.

The optimised structure provided by the Sparkle Optimisation is illustrated below

In order to use this optimised structure in subsequent calculations, it may be necessary to Read --> Last Geometry from MOPAC Calculation. Otherwise, you may encounter an error explaining how the current geometry does not tally with the geometry in the file (or something equally cryptic).
ORCA: How to... calculate UV-Vis spectra for olefins and effects on extended conjugated
Using: Gabedit, MOPAC, ORCA
Method: Fire-up Gabedit, and from the "Geometry" menu, either select Draw or
Load from file. At the draw/geometry window, from the right-click
menu a "MOPAC->Sparkle Optimisation" operation can be initiated.
If the geometry looks about right, then run the full MOPAC Optimisation.
Through the menus, click "Read" -> "MOPAC" -> "Read last Geometry from
MOPAC output file", from the file browser open the preselected file.
Now close the Draw input window. Thereafter, click on the "New Orca Input File" button ( )
from the main Gabedit window.
To calculate a UV-Vis spectrum, a few minor changes to the .inp file can
be made, namely:
- increasing "nroots" from 8 to at least 25 - this is the number of excited states: "nroots 25"
- increasing "maxdim" to 150 -- should be about 5-10x larger than "nroots": "maxdim 150"
- extending the "ewin" absissca window: "ewin -10,150"
- ....or you can just do none of these things, and you'll still get a result out ! do I know how wrong the spectra are? nope!
Note that for all but the most simple of molecules, these calculations can take from minutes to hours to complete. From "Run->Run a Computational Program (Ctrl+R)", then select ORCA, then "OK". The ORCA output file will appear in the open files window, and from here clicking the button "Update/end" will load the current output from the ORCA script. Once ORCA has finished, the end of the output file will state " ****ORCA TERMINATED NORMALLY****". FYI, on my Intel x5660, ethene takes 20 seconds, hexadeca-octaene (CH=CH-CH=CH-CH=CH-CH=CH-CH=CH-CH=CH-CH=CH-CH=CH) took about 50 minutes, chlorophyl took nearly 6 hrs.
Step2: From the "Tools" menu, click "UV-spectrum" --> "Read Energies and intensities from ORCA out file"
Step3: Observe beautiful results.
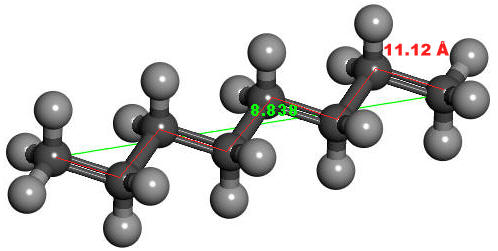
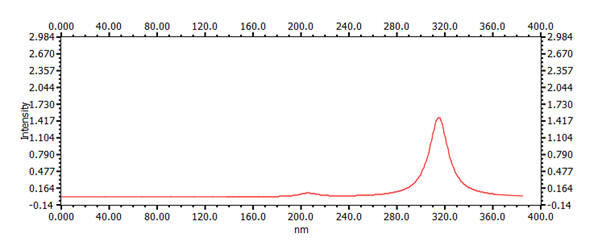
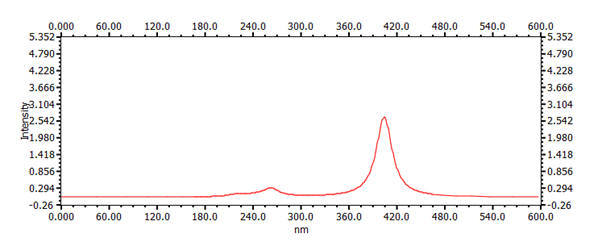
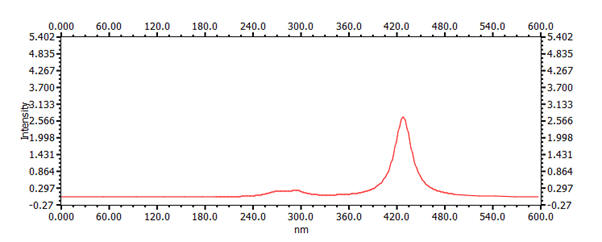
Tabulated below are the resultant UV-Vis spectra for the molecules, along with their calculated Λmax, the distance in Angstroms from terminal-to-terminal (green), and the cumulative bond lengths from end to end (red). For example,

| n = | Olefin | Length | Cumulative Length | Λmax | UV-Vis Spectrum calc. by ORCA |
| 2 | Ethene | 1.34 Å | 174nm |
 |
|
| 4 | 1,3-butadiene | 3.67 Å | 5.56 Å | 230nm |  |
| 6 | 1,3,5-hexatriene | 6.10 Å | 8.34 Å | 279nm |  |
| 8 | 1,3,5,7-octatetrene nb: the x-scale on the graph is different to the others |
8.52 Å | 11.12 Å | 314nm |  |
| 16 |
1,3,5,7,9,11,13,15-hexadecaoctaene nb: 30mins ORCA calculation |
18.25 Å | 22.25 Å | 405nm |  |
| 22 | beta-carotene nb: 5 hrs 50 mins ORCA job; nb: x-axis scale extended |
23.88 Å | 30.58 Å | 428 nm |  |
It is apparent that the Λmax property varies strongly with the number of carbon atoms in the chain. This variation is inversely quadratic with respect to number of atoms and, importantly, the resultant length of the molecule as calculated by the sum of C-C bond-lengths. For example, a plot of the position of Λmax versus chain length is presented graph below.

For some discussion on the orbitals, see here, and further discussion of the ORCA input files and more examples, see here.

For more information, you may enjoy reading the following websites:
- http://sparkle.pro.br/tutorial/uv-vis
- https://lumpac.pro.br/module-2
- https://www.chemtube3d.com/orbitalsbutadieneuv/
GAMESS examples: How to do....
Calculating UV-Vis Spectra